new-data-new-wiley-journal-insights-your-comprehensive-view-into-publication-performance
May 20, 2020
We launched Wiley Journal Insights in 2016 to give our society partners and journal editors secure, easy online access to their publications data. Being able to look at journal and portfolio figures whenever you need it gives our partners a better understanding of performance, helps you spot trends quickly, and supports decision-making and strategic planning.
Using Wiley Journal Insights, our partners can look in detail at download, citation, and financial information for your journals, including headline figures over the last five years or by year, as well as country-based differences—even at the individual article level—and quickly download charts and maps to use in presentations or reports. The app updates each month with new data, so you can identify trends as they emerge.
We’re constantly looking for ways to improve the platform based on your feedback and adding new functionality to provide even more meaningful insights. In 2020, we’ve expanded the range of data available in Wiley Journal Insights so you can now also look at journal performance from a submissions and production perspective. Here’s what’s new this year:
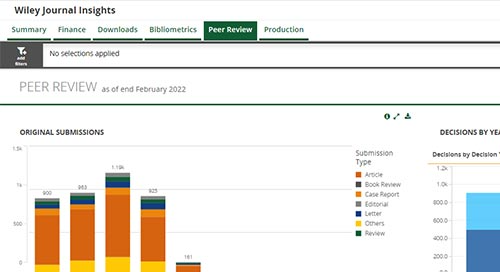
Peer Review Insights
In the new Peer Review tab, you can now look at submission patterns by volume and by article type. By looking at how many papers of each type were referred and transferred, as well as how many were accepted or rejected, you’ll be able to easily answer questions like “how are transfers impacting the journal?” “Is the rejection rate changing over time?” “Who are our most engaged reviewers?” and make even more strategic decisions based on solid data.
Maps that demonstrate the journal’s geographic reach by submitted, accepted, or published authors are now also easy to download and share.
Production Insights
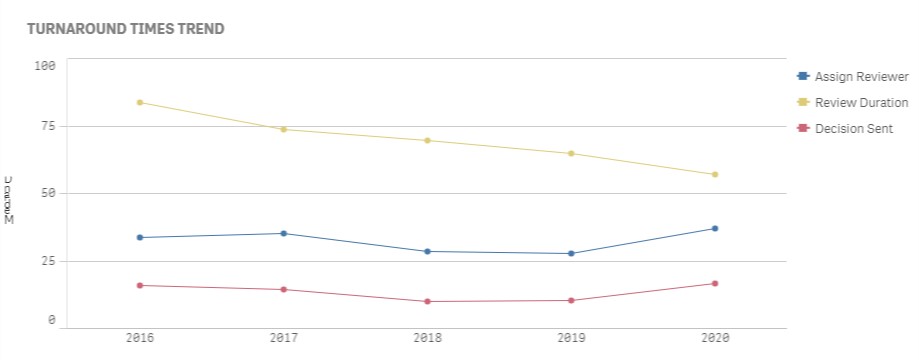
Authors consistently tell us that speed of publication is one of the main factors they consider when selecting where to submit their paper, so both the new Peer Review and Production tabs help you delve into the detail of turnaround times. From long-term trends to looking at specific steps in the process, you’ll have new insight into where publication is moving efficiently, and where the process may be slowed down.
In the Production tab, you’ll also now see a snapshot of total accepted articles and be able to break them down by article type. This tab also supports new insight into the impact of open access on individual journals and across an entire portfolio, with a clear graph showing the number of articles published by year and the proportion of subscription versus open access and OnlineOpen articles.
What’s next?
Full-year 2019 data is available right now throughout Wiley Journal Insights, as well as data for the first quarter of 2020 – so log-in, explore the new peer review and production data for your society’s publications, and consider how the data for 2019 fits with your journal strategy for 2020 and beyond.
And, if you have any feedback or suggestions for how we can make Wiley Journal Insights even better, please get in touch with your Journal Publishing Manager.